


Website Reporting Template Overview
Website performance reports are easy to overlook. Many will simply take screenshots of their Google Analytics (GA) dashboard, paste it on a report, and call it a day.
High-level information like this gives but a glimpse of the overall story. To get to the "why," one must look at the data closely. It doesn't have to take hours to put together, either. Using free Google products, we have created templates anyone can use that automatically update every month.
Each page dives deeper into the website putting color and words to the story that is your website. With this report, you can expect to answer some of the most important questions you might have:
- What channels are driving the most traffic?
- What caused the traffic to drop or increase last month?
- How many visitors are new, and how many are returning?
- What blog posts drive the most engagement?
- Where do conversions happen?
- What marketing channels drive quality traffic?
What You Need Before Getting Started
If you're ready to use this report, let's first cover the basics–What you will need.
This report requires the following:
- Google Analytics 4
- Google Looker Studio (formerly known as Data Studio)
Google Analytics 4 (GA4)
For the template to work, GA4 must be installed, ideally for at least two months.
Please note that Universal Analytics will expire on July 1, 2023. Set up your GA4 now to prepare for this change. Learn more about how to get started with GA4 with this youtube tutorial.
Google Looker Studio (Data Studio)
Looker Studio was once known as Data Studio, but as of October 11, 2022, it is now Looker Studio.
Looker Studio is a free data visualization platform by Google. It makes it easy to connect to various data sources to create customized interactive reports.
If you don't already have one, you will need to create a Looker Studio account. The email you use for Looker Studio must be the same email with access to the Google Analytics account you will be connecting.
Instructions to use Website Report
If GA4 is installed and you've created a Looker Studio account, you are ready to continue with the instructions.
Create a new Data Source in Looker Studio
Now that your Looker Studio account is set up, you need to connect GA4 as a data source.
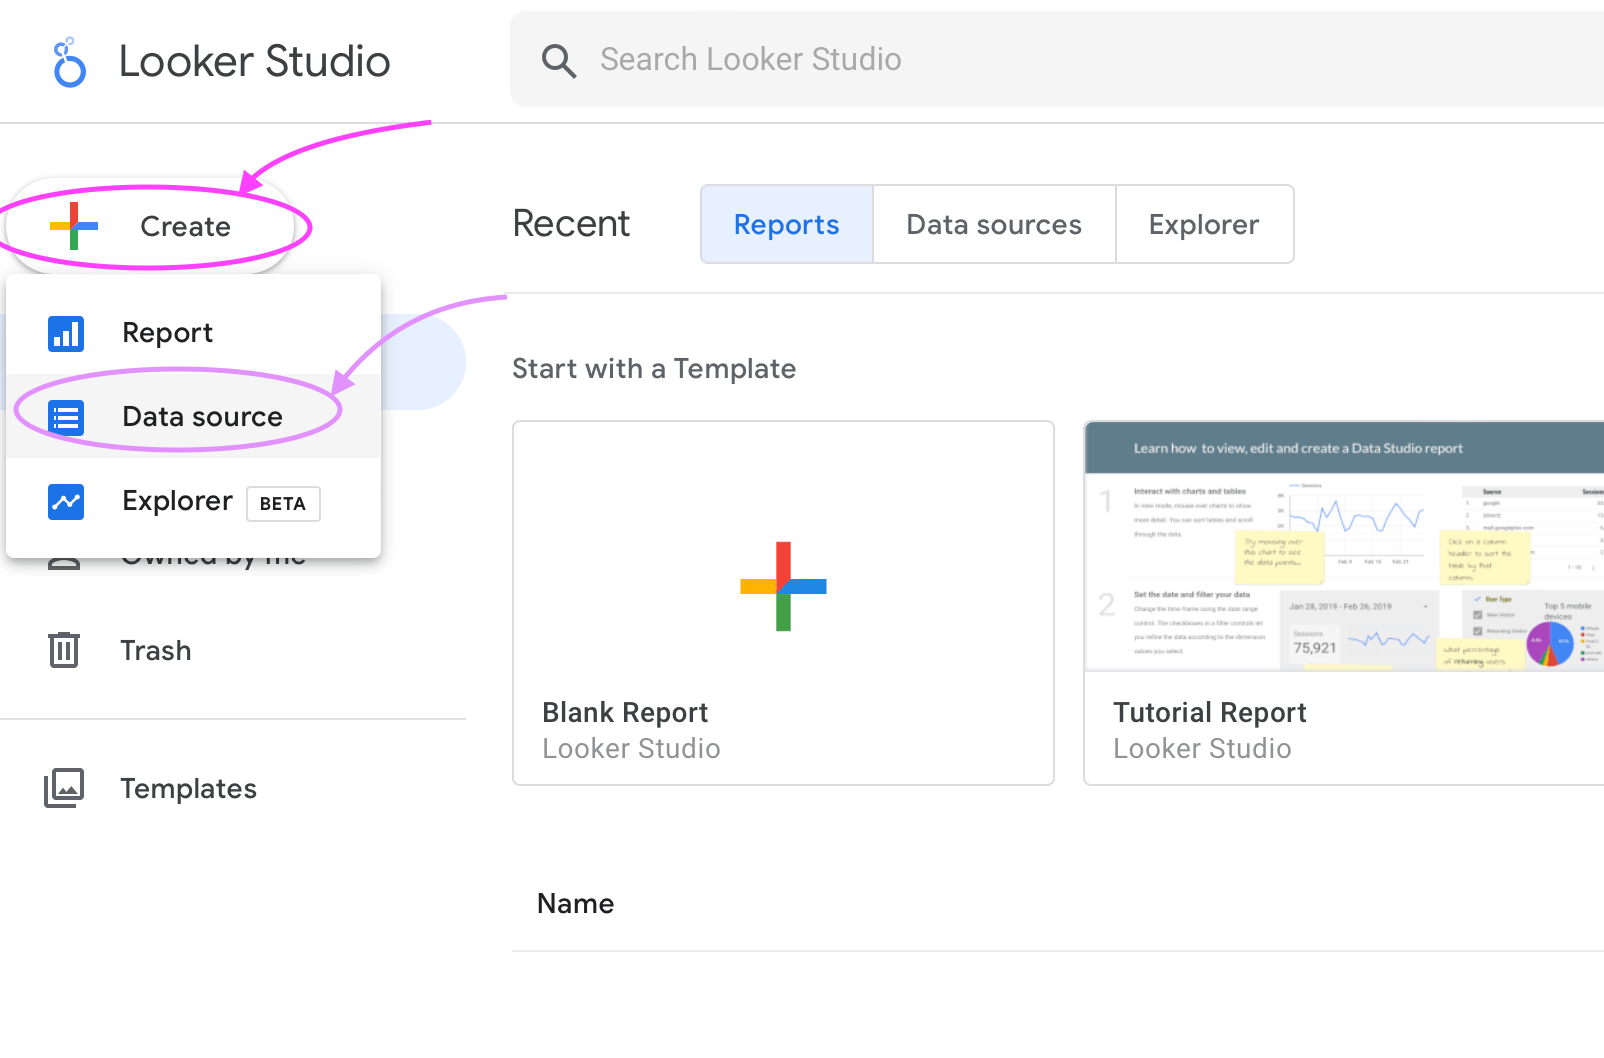
Step 1: From your Looker Studio home dashboard screen, click "Create" then "Data source."
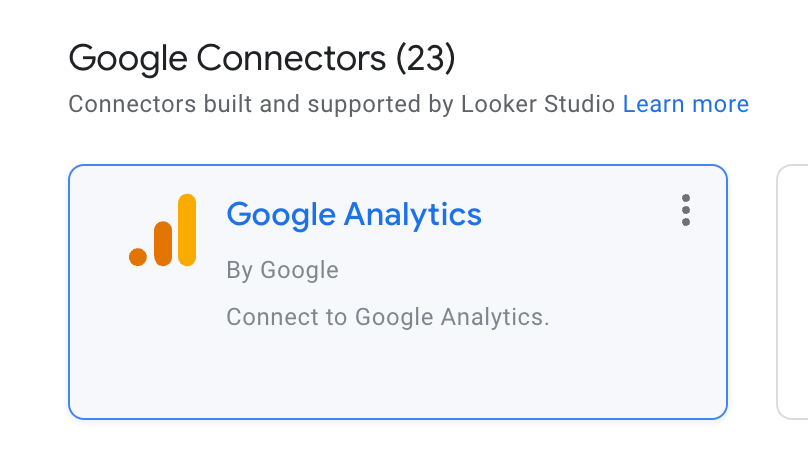
Step 2: Select "Google Analytics."
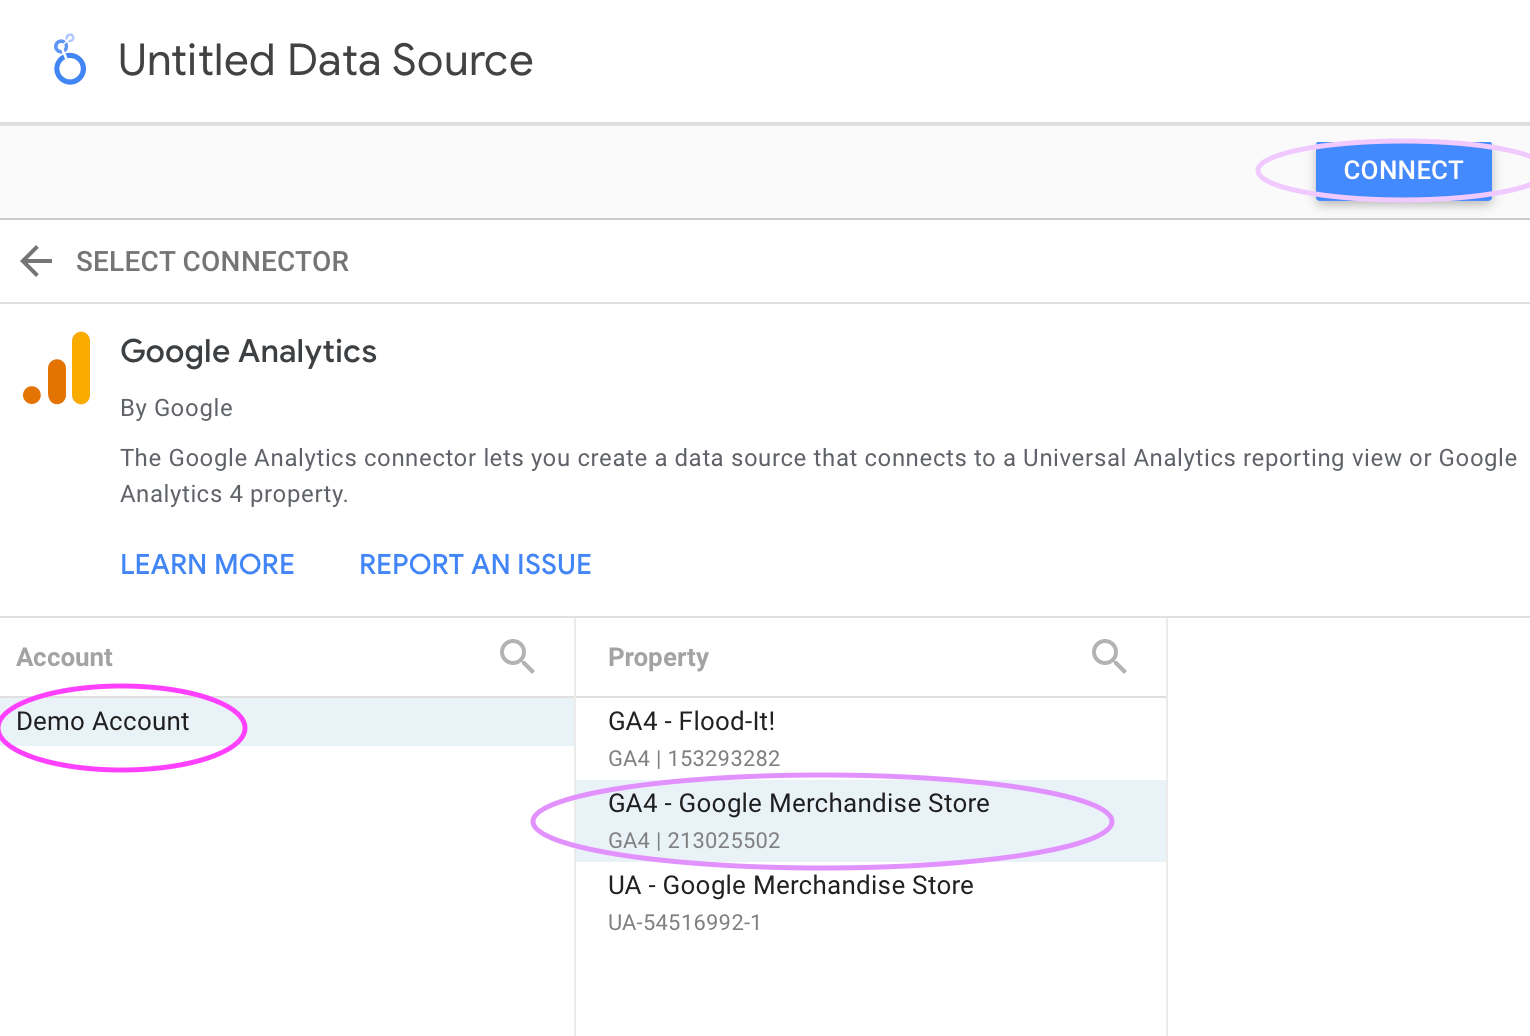
Step 3: Select the desired Google Analytics Account and Property.
For this tutorial, I'm selecting a demo account, but you choose the Account and Property linked to your website's GA account.
Step 4: Now you are done. Click the Looker Studio logo symbol to go back to the home dashboard.

Duplicate the Template
After you've connected GA4, you are ready to copy the template.
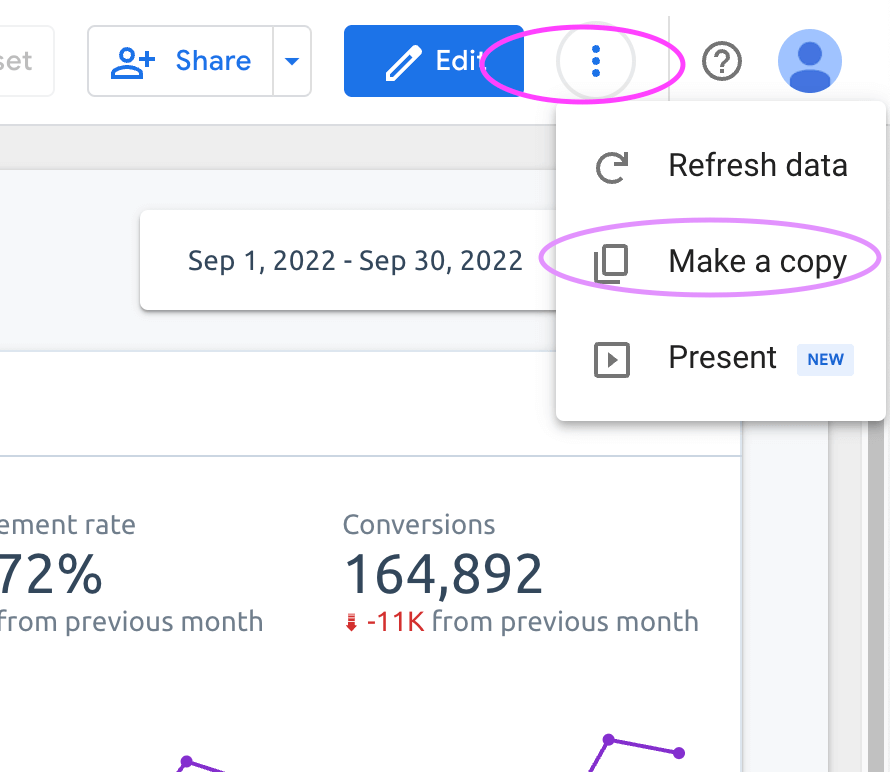
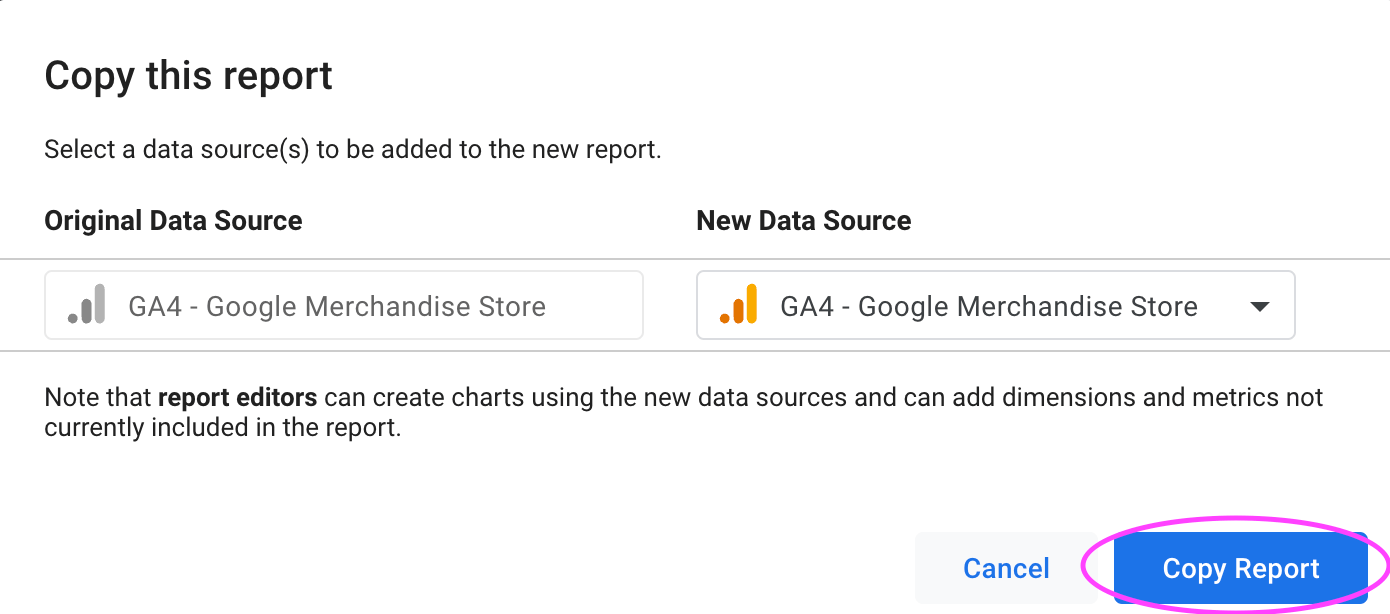
Step 1: Select the three vertical dots in the right-hand corner, then click "Make a copy."
Step 2: Next, select the GA4 data source you've added.
.png)
Step 3: Click "Copy Report" and you are done. Continue reading to learn how to customize the template branding.
How to Customize Theme Colors and Fonts in Looker Studio
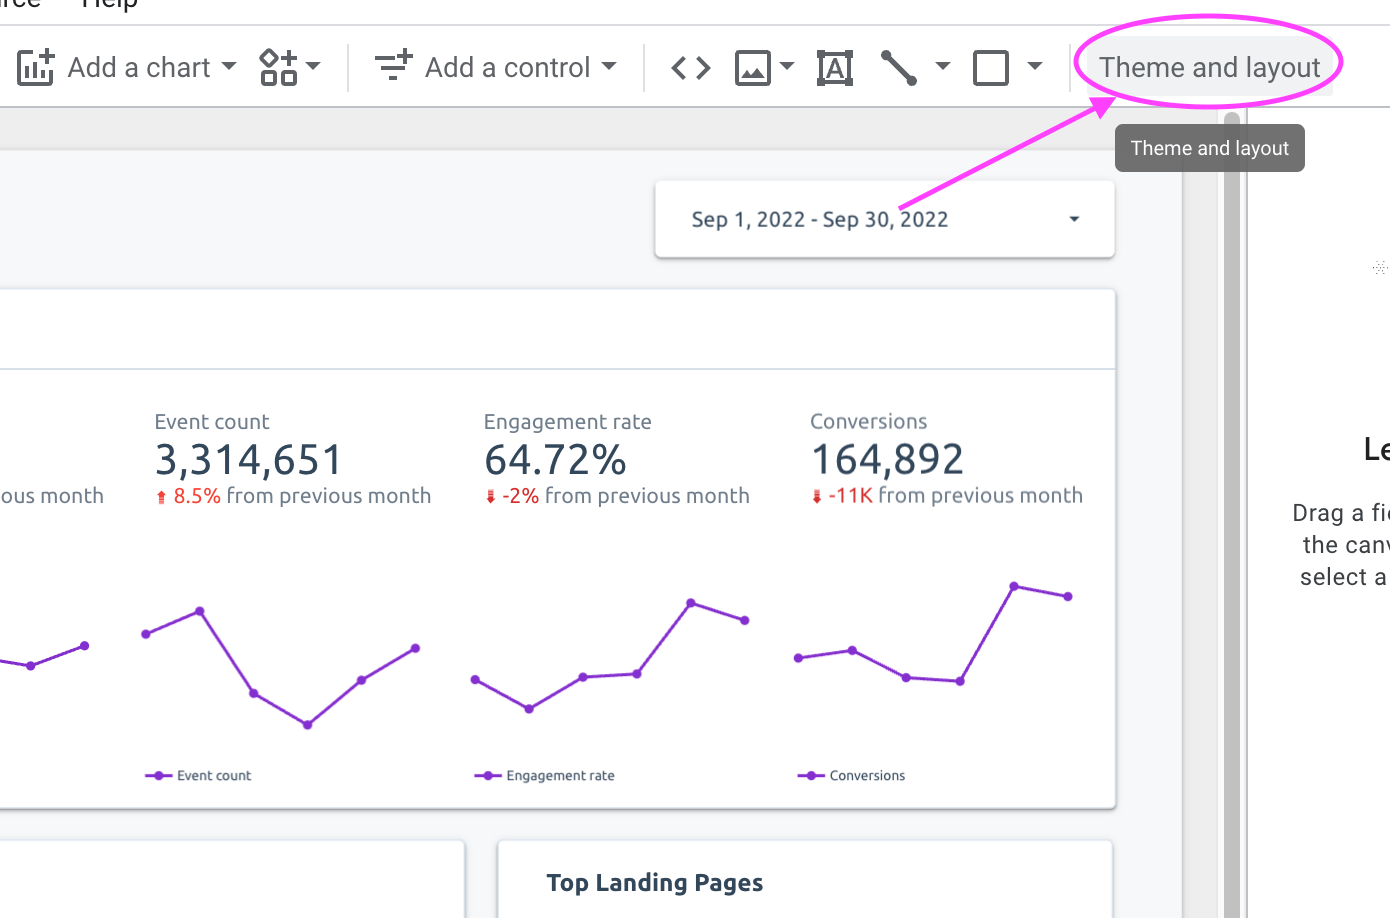
Step 1: To modify colors and fonts, select "Theme and layout."
Step 2: Next, select "Customize."
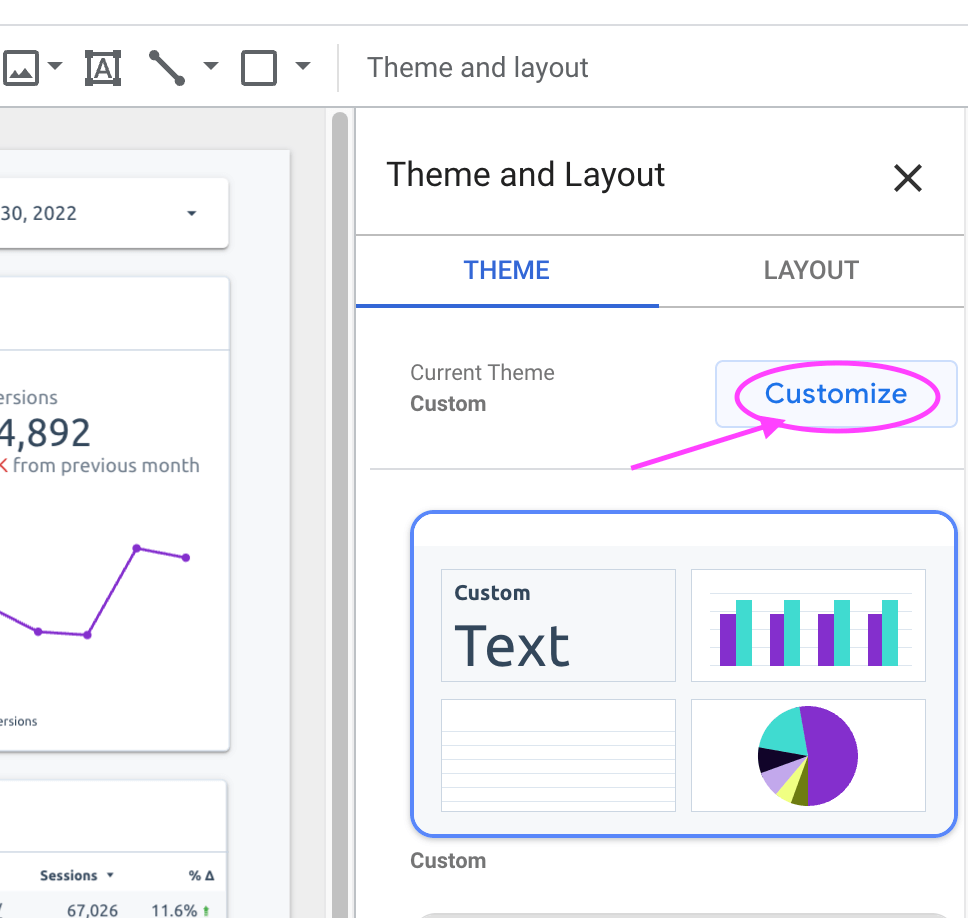
Step 3: Change the theme settings and save your changes.
Managing the Report
This report updates each month automatically. By the 1st of the month, the report will automatically update. This makes it effortless to manage and easy to use.
Looker Studio is a great data visualization tool. We highly recommend you continue learning the ins and outs of Looker Studio so you're able to make customizations or create a new report from scratch.
Now that you have your website performance report, you can answer those "why" questions. Be fully informed about what goes on your website.